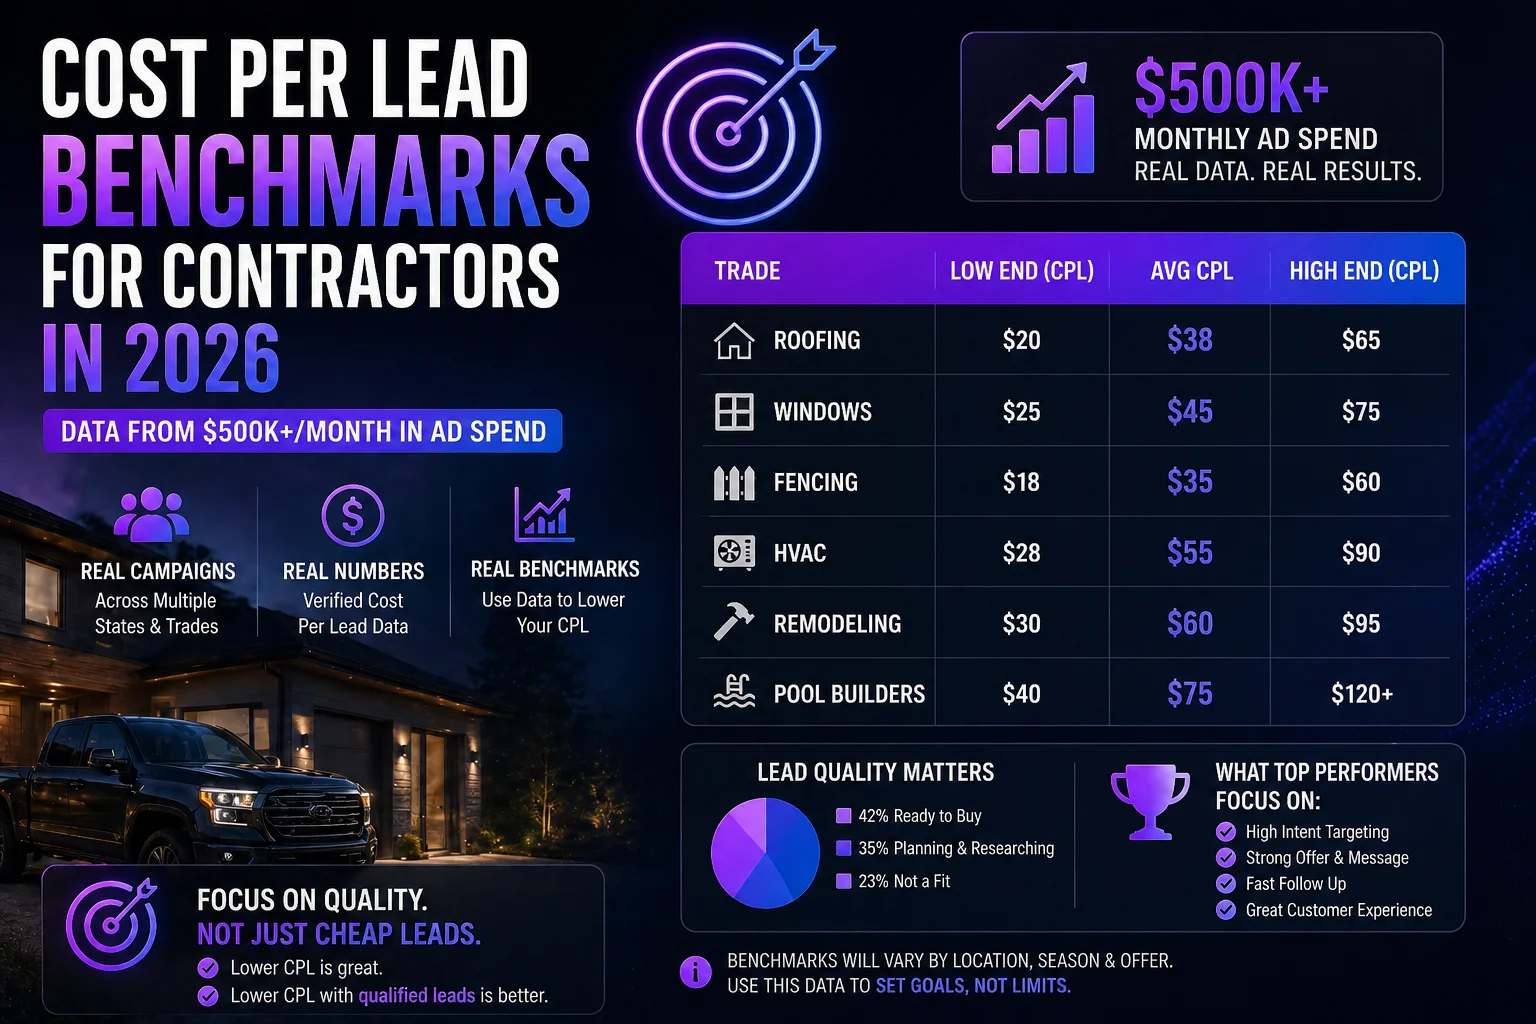
We manage more than $500,000 per month in paid media for contractors across the United States, roofing, pool building, general contracting, remodeling, HVAC, and specialty trades. That level of spend buys a lot of data. It also buys a lot of expensive lessons. This is the first time we’ve written down exactly how that money moves, which metrics actually matter, and how we find the next winning ad when the current one stops working.
If you’re a contractor running your own ads, or paying an agency that still talks about “impressions”, this is what a modern 2026 contractor media budget actually looks like from the inside.
Quick Answer
How we allocate $500K/month in contractor media spend:
- 55% Meta (Facebook + Instagram)
- 30% Google Search + Local Services Ads (LSA)
- 10% Google Display + YouTube
- 5% Retargeting and CRM-based re-engagement
The two metrics we track daily: cost per booked appointment and closed-won revenue per ad account per week. Everything else is noise.
Table of Contents
- The Channel Split (And Why It Shifts)
- Metrics We Don’t Care About
- Metrics We Live By
- How We Test Creative
- How We Find the Next Winner
- Budget Pacing and Reallocation
- The Real Lesson After $6M in Spend
- FAQ
The Channel Split (And Why It Shifts)
Roughly 55% Meta, 30% Google Search + LSA, 10% Google Display + YouTube, 5% retargeting. That’s the baseline we start every new account on.
But the mix shifts hard depending on the vertical, the market, and the season.
How the mix changes by vertical
- Roofing: Heavier on Google Search and LSA (50%+ of spend) because roof leaks are high-intent, “I need this today” searches. Meta is still critical for demand generation before storm season.
- Pool builders: 70% Meta because buying a pool is aspirational, you have to show it to them before they search for it. Google Search on “pool builder near me” is a closer, not a generator.
- Remodeling and general contracting: 50/50 Meta and Google. Long sales cycle, so retargeting gets a bigger slice (10–15%).
- HVAC and emergency-service trades: 60% Google + LSA because urgency drives search. Meta is for maintenance plans and replacements, not break-fix.
How the mix changes by season
Storm season for roofers doubles Meta spend overnight. Pool builders drop Meta in January and scale it aggressively starting in March. Remodeling holds steadier year-round but shifts budget to retargeting in Q4 when decision-making slows.
The baseline gets you started. The vertical and the season tell you where to move from there.
Metrics We Don’t Care About
These are the metrics contractors get sold on in dashboards, and the metrics that have almost no correlation with revenue.
- CPC (cost per click), A $2 click that doesn’t book is worse than a $12 click that does
- CTR on cold traffic, High CTR often correlates with low buyer intent
- Frequency, Unless it’s broken (frequency > 5), it doesn’t tell us anything actionable
- “Engagement”, Likes, comments, shares don’t pay invoices
- Impressions / Reach, Vanity metric. We don’t optimize toward it
- Vanity ROAS from the platform, Meta and Google ROAS numbers are both inflated by last-click and view-through attribution
If your agency reports to you on these metrics without connecting them to booked appointments and closed revenue, you’re being managed by a marketing team, not a growth team.
Metrics We Live By
Every contractor account we run has a custom dashboard built around four numbers.
1. Cost per booked appointment (CPBA)
The single most important number in contractor marketing. This is the true cost to get a human being on your calendar with buying intent. We target:
- $40–$80 for roofing (storm + non-storm blended)
- $100–$200 for pool builders (higher ticket, longer cycle)
- $60–$120 for remodeling and GC
- $30–$60 for HVAC break-fix
2. Closed-won revenue per ad account, per week
This is the only metric that tells you whether your ad spend is actually building a business. We watch it weekly, track it against a 4-week moving average, and flag any account where closed revenue drops below 3x spend.
3. Blended CAC across all channels
Cost to acquire a closed customer, blended across every channel, organic, paid, referral, direct. This is your true marketing efficiency number. When CAC is stable and revenue is growing, you’re healthy. When CAC is creeping up while revenue is flat, something in the funnel is breaking.
4. Percentage of spend that produced zero booked jobs
This is the leak metric. How much of your weekly spend went to ad sets, keywords, or campaigns that generated zero booked appointments? Healthy accounts sit under 15%. Broken accounts run 40%+.
How We Test Creative
Every account runs 2–3 creative tests per week. Winners replace bottom performers. Losers get killed at 1x CPA.
The test structure
- Test budget: 15–20% of weekly ad spend
- Test duration: 5–7 days minimum, or $3x target CPA, whichever comes first
- Variables tested: Hook, offer, format, never all three at once
- Criteria for winner: CPBA beats the control by 20%+ with statistical significance
What we test (in order of impact)
- Hooks (first 2 seconds of video). Single biggest lever.
- Offers (what the ad actually promises). Second biggest lever.
- Formats (UGC vs. produced, static vs. video, single vs. carousel).
- Headlines and primary text. Marginal impact compared to the first three.
- Audience (rarely, we let the algorithm handle this).
We don’t test button colors. We don’t test CTAs. Those are rounding errors compared to hook and offer.
How We Find the Next Winner
The ads that win in month 6 usually look nothing like the ads that won in month 1. Creative burns out. Markets shift. Competitors copy. Our job is to stay ahead of that curve.
Where we get new creative ideas
- Competitor ads in the Meta Ad Library (daily scan)
- Customer sales calls (listen for the exact language buyers use)
- Recent 5-star reviews (real language, real objections handled)
- Failed ads (sometimes a losing ad has a great hook attached to a weak offer, split it apart)
- What’s working in adjacent verticals (roofing creative often lifts when we borrow from solar, remodeling when we borrow from landscaping)
The 70-20-10 creative rule
- 70% of creative budget goes to proven formats and winners
- 20% goes to variations of winners (new hooks, new angles)
- 10% goes to wild swings, new formats, new concepts, creative that might fail
Without the 10%, you eventually run out of winners. That’s how accounts die.
Budget Pacing and Reallocation
We reallocate budget every Monday based on the previous 7 days of closed-won performance.
The rules
- Any campaign with CPBA below target gets +20% budget
- Any campaign with CPBA above target for 2 weeks gets -30% budget
- Any campaign with zero booked jobs for 2 weeks gets paused
- No single ad set gets more than 40% of account spend (concentration risk)
What we don’t do
- We don’t reallocate daily. Daily noise is not signal.
- We don’t chase “best day” performance. One great day is often a bad lead mix that the rep hasn’t flagged yet.
- We don’t let account managers make budget decisions without CRM data. If the CRM doesn’t show booked appointments and closed revenue, the agency is guessing.
The Real Lesson After $6M in Spend
The contractors who grow fastest aren’t the ones with the highest ad budget. They’re the ones whose system turns spend into appointments into revenue the fastest, with the fewest leaks along the way.
Budget is a multiplier on a process. If your process converts at 10% of leads to booked jobs, doubling your ad spend doubles your leads, and your waste. If your process converts at 40%, every dollar of added ad spend is four times as valuable.
Here’s what that looks like in practice:
- Contractor A: $20k/month ad spend, $250 CPBA, 15% lead-to-close. → 12 jobs/month.
- Contractor B: $20k/month ad spend, $75 CPBA, 40% lead-to-close. → 106 jobs/month.
Same spend. 9x the output. The difference isn’t the ads. It’s the system underneath them.
That’s why every account we manage is built on the full stack: paid media, a live call center answering inbound leads in under 60 seconds, a CRM with automatic attribution, and sales enablement for the closing team. Ads alone don’t make money. A system does.
FAQ
How much should a contractor spend on Facebook ads?
Minimum viable spend for a contractor Facebook campaign in 2026 is $3,000–$5,000 per month. Below that, you can’t generate enough conversions to exit the learning phase, and the algorithm can’t stabilize.
What’s a good ROAS for contractor ads?
We target a minimum of 5x closed-won ROAS across the full account (not platform-reported ROAS, which is inflated). High-performing accounts run 10x–20x closed-won ROAS.
How much of my budget should go to Meta vs. Google?
Start at 55% Meta / 30% Google Search + LSA / 10% Display + YouTube / 5% retargeting. Shift based on vertical, more Google for urgent trades (roofing, HVAC), more Meta for aspirational trades (pool building, remodeling).
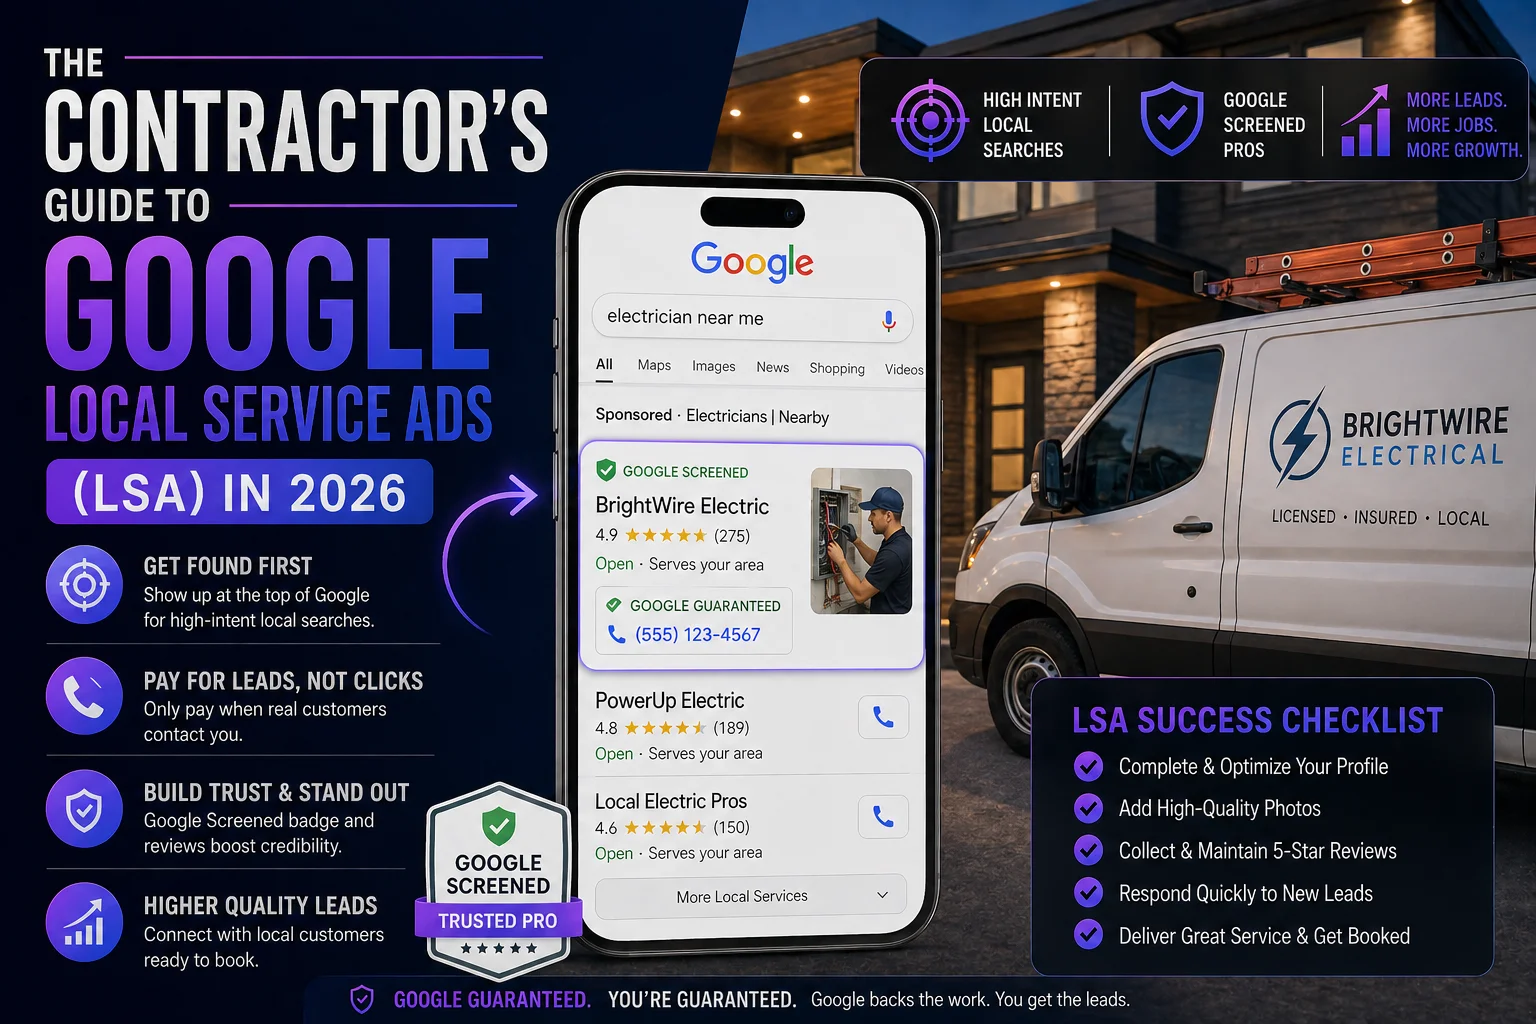
Should contractors run LSA (Local Services Ads)?
Yes, if you can pass Google’s screening. LSA leads typically convert 30–50% higher than standard search clicks because they come through a pre-qualified Google interface. It should be 10–20% of your Google budget at minimum.
How often should I review ad spend allocation?
Review weekly, reallocate weekly, rebuild quarterly. Daily is too noisy. Monthly lets underperformers drain too much budget before you catch them.
What’s the biggest waste of ad budget for contractors?
Optimizing for the wrong event (clicks or form fills instead of booked appointments), and running the same creative for too long. Those two account for most of the waste we find in contractor audits.
The Bottom Line
A $500k/month media budget isn’t magic. It’s discipline, around which metrics matter, how often you test, when to reallocate, and what process the spend feeds into. Contractors don’t fail at marketing because they can’t spend enough. They fail because they spend without a system.
If you’re curious what this looks like applied to your account, book a call and we’ll walk through your numbers side by side with ours. No pitch deck, just real math.